New Graph: Position Tab
Description
Specifies the positions where results are extracted for graphing purposes.
Available options vary depending on the type of analysis and graph being defined.
Vs Position
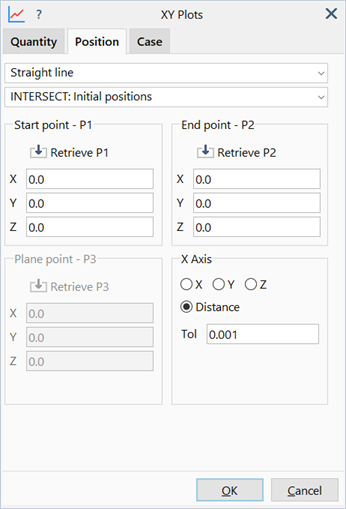
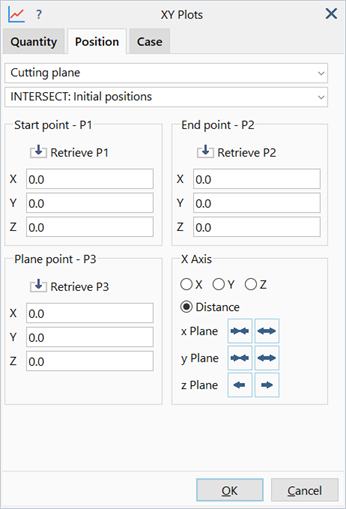
Plots results along a path (line) or on cutting plane, for one or more result cases.
Dialog
Position
Specifies how the line is defined.
-
Straight Line
Extracts results along a straight line defined by two points.
Points in the model are considered to be on the line if they lie within the tolerance distance.
-
Cutting Plane
Extracts results on a plane defined by three points.
The cutting plane tolerance can be adjusted by clicking the icons with nudge arrows.
-
UCS
Extracts results on a line defined on a UCS.
The line can curved if the UCS is cylindrical, for example.
INTERSECT
-
Initial positions
Extracts results based on intersections with the undeformed model.
The line is defined based on the undeformed coordinates of the click points; the undeformed elements are intersected with the line.
-
Deformed positions
Extracts results based on intersections with the deformed model.
The line is defined based on the deformed coordinates of the click points due to the current displacement scale; the displaced elements, due to the current displacement scale, are intersected with the line.
Start / End / Plane Points (X / Y / Z)
Points used to define the straight line or cutting plane.
Retrieve P1 / P2 / P3
Global coordinates of the points used to define the straight line can be retrieved from points in the model window, or entered manually.
X Axis
Definition of the horizontal axis of the graph.
-
X, Y, Z (or R, T, Z)
The selected coordinate of the nodes or intersection point on the element is used as the X axis value on the graph.
-
Distance
The distance between the start point and the node or intersection point on the element is used as the X axis value on the graph.
Tolerance
Ratio which defines the distance used to determine if a point on the model is on the line.
Actual distance used is the ratio multiplied by the length of the line.
Nudge Arrows
Shrink or expand the cutting plane in the local x and y directions.
The plane can also be moved in the normal (z) direction.
Vs Result Case
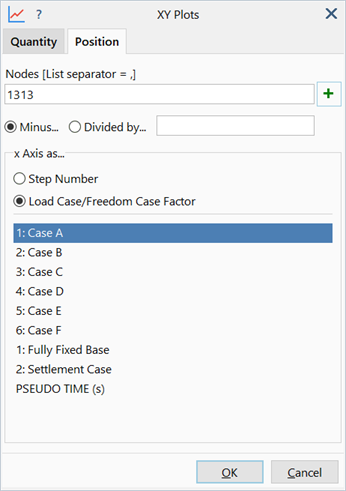
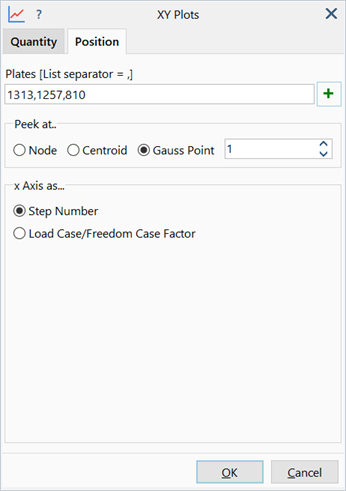
Plots results at a specific entity as a function of result cases, which may be load increments, time steps or frequency steps.
Entity Numbers
Numbers of entities at which results are extracted.
Clicking the text box activates the hot pointer, allowing for the selection of entities from the model window. Entity numbers can also be entered manually.
Multi-Select
If set, multiple entity numbers can be retrieved during selection mode so that multiple lines can be produced on a single graph. Additional lines can also be added later if required.
If not set, the selection mode deactivates after a single entity number is retrieved.
Minus... / Divided by...
Modifies extracted results at nodes by subtracting or dividing by the result at another node. This enables the production of graphs potting the difference or the ratio between the results at two points.
Clicking the text box activates the hot pointer, allowing for selection of the node from the model window. The node number can also be entered manually.
If a node number is invalid or not provided, the extracted results are not modified.
Peek at...
Location within plate or brick elements from which results are extracted.
-
Node
Extracts plate results at nodes.
The entity numbers list is interpreted as a list of node numbers.
-
Centroid
Extracts plate results at the centroid.
The entity numbers list is interpreted as a list of plate numbers.
-
Gauss Point
Extracts plate results at Gauss points.
If selected, a number box becomes available to specify the Gauss point.
The entity number list is interpreted as a list of plate numbers.
See Results Interpretation: Gauss Point Extrapolation and Averaging.
x Axis as...
Definition of the horizontal axis of the graph.
Applicable only to nonlinear static results.
-
Step Number
The result step (or case) number for each of the extracted result points is used as the X axis values on the graph.
-
Load Case / Freedom Case Factor
The selected load or freedom case factor for each of the extracted result points is used as the X axis values on the graph.
Vs Series of Points
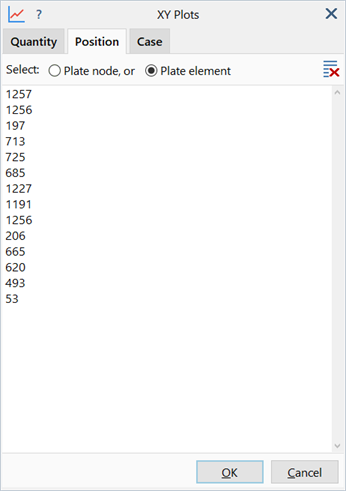
Plots results at an ordered series of 'points', for one or more result cases.
Entity List
List of entity numbers indicating where results are extracted.
Numbers may be retrieved by clicking entities in the model window. Alternatively, numbers may be entered manually or pasted from the clipboard.
Select
Location within plate or brick elements from which results are extracted.
-
Node
Extracts results at nodes.
The entity numbers list is interpreted as a list of node numbers.
-
Centroid
Extracts results at the centroid.
The entity numbers list is interpreted as a list of element numbers.
Clear Points
Clears the entity number list.
See Also