Results Interpretation: Thin vs Thick Beams
Description
The following cantilever beam example illustrates the difference between thick and thin beam results.
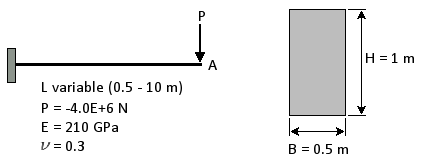
A single beam element with five integration points is modelled. The beam has a width B of 0.5 m and a depth H of 1.0 m. The beam is fixed at one end and a point force is applied to the other end. Elastic modulus of 210 GPa and Poisson's ratio of 0.3 are used. The length of the beam, L, is varied between 0.5 m and 10.0 m. The model is run using the thin beam and the thick beam theories in SOLVERS: Linear Static Settings, and the two sets of displacement results are compared in the table and graph below.
| L/H | Thin Beam Result (m) | Thick Beam Result (m) | Thick / Thin Results Ratio |
| 0.5 | -1.90E-05 | -7.85E-05 | 4.12 |
| 0.6 | -3.29E-05 | -1.04E-04 | 3.17 |
| 0.7 | -5.23E-05 | -1.35E-04 | 2.59 |
| 0.8 | -7.80E-05 | -1.73E-04 | 2.22 |
| 0.9 | -1.11E-04 | -2.18E-04 | 1.96 |
| 1.0 | -1.52E-04 | -2.71E-04 | 1.78 |
| 1.3 | -3.35E-04 | -4.89E-04 | 1.46 |
| 1.6 | -6.24E-04 | -8.14E-04 | 1.30 |
| 2.0 | -1.22E-03 | -1.46E-03 | 1.19 |
| 2.5 | -2.38E-03 | -2.68E-03 | 1.12 |
| 3.0 | -4.11E-03 | -4.47E-03 | 1.09 |
| 4.0 | -9.75E-03 | -1.02E-02 | 1.05 |
| 5.0 | -1.90E-02 | -1.96E-02 | 1.03 |
| 6.0 | -3.29E-02 | -3.36E-02 | 1.02 |
| 7.0 | -5.23E-02 | -5.31E-02 | 1.02 |
| 8.0 | -7.80E-02 | -7.90E-02 | 1.01 |
| 9.0 | -1.11E-01 | -1.12E-01 | 1.01 |
| 10.0 | -1.52E-01 | -1.54E-01 | 1.01 |
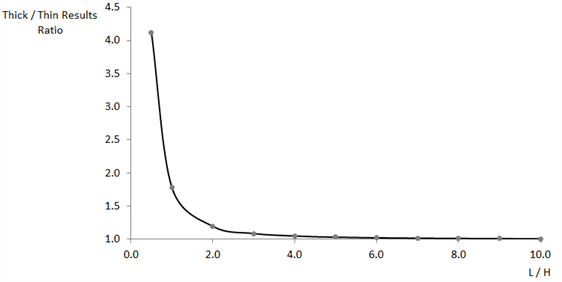
Plotting the thick to thin results ratios against the length to depth ratios, below, shows that the two beam formulations produce agreeable results only when the span of the cantilever beam is long relative to its depth. This is because the deflections of long and slender beams are mainly comprised of bending actions while the deflections of short and stubby beam have higher contributions from transverse shear deformation.
See Also