Special Topics: How Solvers Use Tables
Description
Tabular values in Strand7 are interpolated and extrapolated according to the table-specific rules detailed below.
Interpolation of Tabular Values
Strand7 carries out a linear interpolation between points in a table to calculate intermediate values.
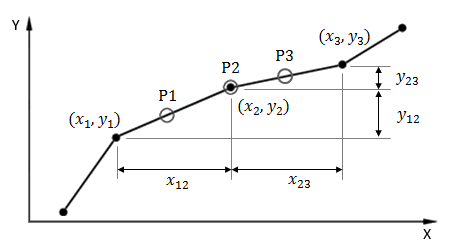
Y Value
For a given X value, the Y value is found by linear interpolation over the segment containing X.
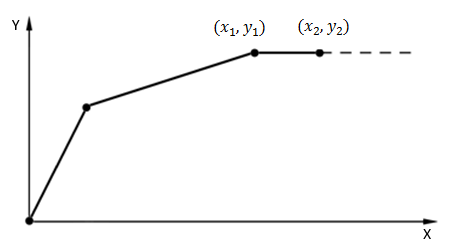
Gradient
The gradient at any point X is equal to the gradient of the line on which X falls. When X falls exactly on a point in the table, the gradient of the following segment is used. Examples are illustrated in the figure below.

Data outside the X range
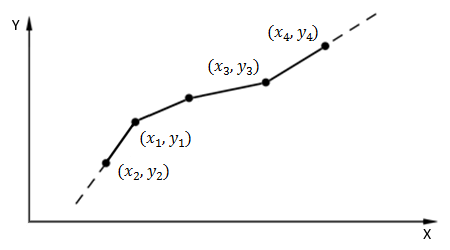
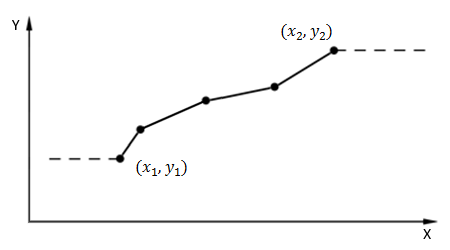
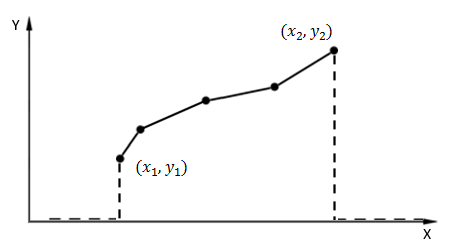
The method used to extrapolate data outside the table range depends on the table type. Three methods for extrapolating the data are used.
-
Extending a table by continuing the gradient at both ends as shown in the following figure. This is used with the following tables: Stress vs Strain, Force vs Displacement, Force vs Velocity, Moment vs Curvature and Moment vs Rotation.
-
Extending a table by keeping the Y value constant at both ends as shown in the following figure. This is used with all table types except those listed in method 1 above and Factor vs Time tables.
-
Setting the data outside the range to zero as shown in the following figure. This is used with Factor vs Time tables.
Summary of table extrapolation modes
| Table Type | The end gradients are maintained. | The end Y values are maintained | The Y values are set to zero. |
| Acceleration vs Time | ✔ | ||
| Velocity vs Time | ✔ | ||
| Displacement vs Time | ✔ | ||
| Factor vs Velocity | ✔ | ||
|
Factor vs Time (when used for load and displacement) |
✔ | ||
|
Factor vs Time (when used for material properties) |
✔ | ||
|
Factor vs Time (when used for heat flux and heat source attributes) |
|
|
✔ |
|
Factor vs Time (when used for heat transfer radiation/convection coefficients) |
|
✔ |
|
| Factor vs Temperature | ✔ | ||
| Factor vs Frequency/Period | ✔ | ||
| Factor vs Position | ✔ | ||
| Temperature vs Time | ✔ | ||
| Strain vs Time | ✔ | ||
| Stress vs Strain | ✔ | ||
| Force vs Displacement | ✔ | ||
| Force vs Velocity | ✔ | ||
| Moment vs Curvature | ✔ | ||
| Moment vs Rotation | ✔ |
Note that to define elastic-perfectly-plastic material behaviour for Stress vs Strain, Moment vs Curvature, Moment vs Rotation and Force vs Displacement tables, the last two points in the table must have the same Y value. Strand7 considers that the table is extended as shown in the following figure. An additional requirement for these tables is that they have a point at (0,0).
Duplicate X Values
Duplicate X values, as illustrated in the figure below, may be used in some situations (e.g., in a Factor vs Time table used to scale a load case as a function of time).
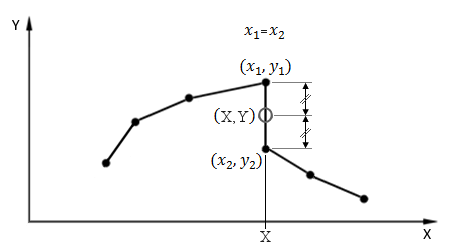
Y Value
For an X precisely equal to the duplicate point, the Y value is taken as the average of the y values. That is,

For other X values, the interpolation rules described above are used.
Gradient
The gradient cannot be evaluated at an X precisely equal to the duplicate X value. An error will be generated if it is attempted.
Effect of Nonlinear Type in the Element Property Definition
When a table is used to define nonlinear material behaviour for Stress vs Strain, Moment vs Curvature, Moment vs Rotation and Force vs Displacement, the type of nonlinearity, yield criterion and element type determine whether only the positive side or both sides of the table are used.
|
Table Type |
Criterion or usage | Nonlinear Elastic | Elastic-Plastic |
|
Stress vs Strain |
von Mises | Positive side | Positive side |
|
Stress vs Strain |
Tresca | Positive side | Positive side |
|
Stress vs Strain |
Max Stress | Both sides | N/A |
|
Stress vs Strain |
Beam Fibre Stress |
Both sides |
Both sides |
|
Moment vs Curvature |
Beam | Both sides | Both sides |
|
Moment vs Rotation |
Connection Beam Spring-Damper |
Both sides |
Both sides |
|
Axial Force vs Displacement |
Beam | Both sides | Both sides |
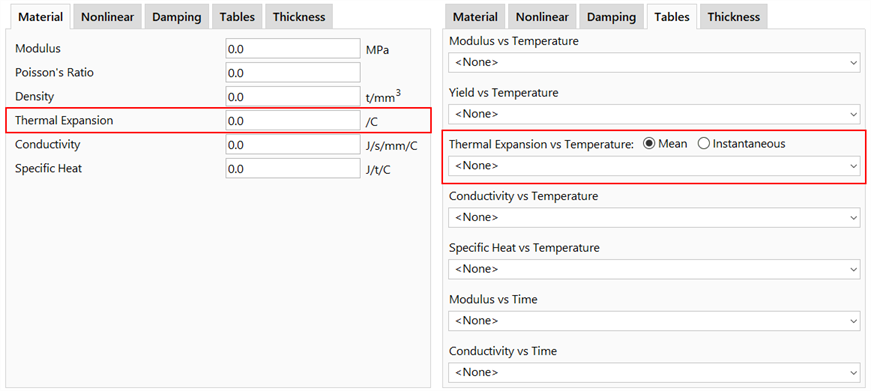
Thermal Expansion vs Temperature
When a Factor vs Temperature table is used in an element property definition to describe the variation of thermal expansion coefficient with temperature, the thermal expansion coefficient,  , at a temperature,
  , is calculated as
  , where
  is the nominal value of the coefficient defined in the material property data, and
  is the table factor at the specified temperature interpolated from the Factor vs Temperature table (see Properties: Tables).
When such a table is used, a distinction is made between an instantaneous thermal expansion coefficient and a mean thermal expansion coefficient. This is specified on the property dialog via the Mean and Instantaneous options.
The instantaneous coefficient is straightforward: the coefficient of thermal expansion at any temperature,  , is simply the gradient of the
  relationship at that temperature. Therefore, the total thermal strain increment generated between two points on the table (i.e., from
  to
to  ) is found by integrating the table between those two temperature values and multiplying by
  . That is,

This is effectively the sum of all incremental thermal expansions from  to
to  .
.
On the other hand, the mean coefficient at any temperature,  , represents the average thermal expansion coefficient relative to some reference temperature,
  , used to produce the Factor vs Temperature table (
 is not necessarily the same as the reference temperature,
  , used in the Strand7 model). In this case, the strain increment from
  to
to  is equal to the difference between the strain at
  and the strain at
  . That is,

Where  ,
, 
 is taken as the first point in the Factor vs Temperature table.
See Also