LAYOUTS: Tables
Description
Creates, edits and graphs tabular data, referred to as tables in Strand7.
Tables specify how a quantity varies as a function of another quantity, and are extensively used in a Strand7 model. Tables can be used for describing nonlinear material behaviour, earthquake accelerations, impulse signals, and so on.
Once defined, a table must be associated with some other part of the model in order for it to be used. For example, a table of Factor vs Temperature can be assigned to a plate property to describe how the Young's modulus of the material varies with temperature. Until that association is made, the table remains unused.
A range of table types may be defined, each for a different purpose (see Special Topics: Table Types).
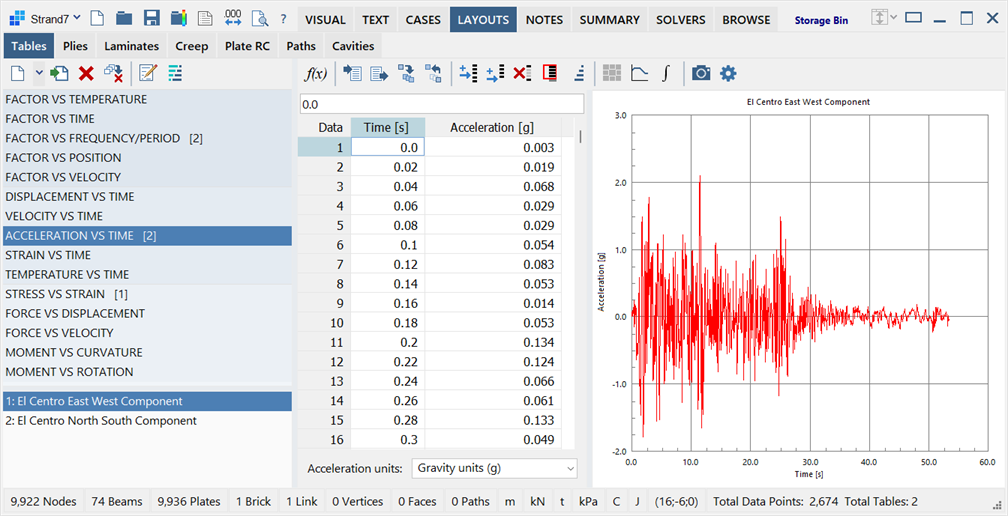
The LAYOUTS: Tables sub-tab is divided into three panes: table types and table list on the left, tabular data grid in the middle, and graph display on the right.
Table Types and Table List
Situated on the left of the window, the upper part of the pane lists all available table types and their respective table counts in the model, while the lower part lists the available tables for the highlighted table type.
Tabular Data Grid
Situated in the middle of the window, the three-column grid displays the data points of the current table.
- The first column contains the data point identifier, which cannot be edited. Its values are automatically updated as the number of entries in the table is changed.
- The second column contains the x values of the table. The quantity and units of this column depend on the table type.
- The third column contains the y values of the table. The quantity and units of this column depend on the table type.
One or more of the following controls may be found at the bottom of the grid, depending on the table type.
Time unit
Specifies the time unit for vs time tables.
Factor unit
Specifies the factor type, response or PSD, and the corresponding units for vs frequency/period tables.
Acceleration units
Specifies the acceleration unit for acceleration vs time tables.
Rotation unit
Specifies the rotation unit for vs rotation tables.
Graph Pane
Situated on the right of the window, it displays the data points in a graphical form.
Toolbar Functions
In addition to the common controls, the following functions are available:
Import new tables from files
Opens the Open File dialog, which enables the selection and bulk import of multiple text files, each as a new table.
Text files can be in either Fixed Format or Free Format as described in File Formats: Table Data File.
Equation editor
Opens the Tables: Equation Editor, which enables the generation of tabular data by evaluating a mathematical function.
Import table data
Opens the Open File dialog, which enables the import of a text file into the current table. The function can also be executed on multiple tables at once by multi-selecting the table names in the table list: the same data will then be imported into all the selected tables.
Text files can be in either Fixed Format or Free Format as described in File Formats: Table Data File.
Export table data
Opens the Save File dialog, which enables the export and saving of the tabular data from the current table into a Fixed Format text file. The function can also be executed on multiple tables at once by multi-selecting the table names in the table list: each table will then be exported into a separate text file.
See File Formats: Table Data File for a description of the fixed format text file.
Insert row
Inserts a new row in the grid before the highlighted cell. The values in the inserted row will be interpolated from the cells above and below it.
Add row
Adds a new row to the end of the grid. The new cells will be initialised with zero.
Delete selected rows
Deletes the highlighted rows.
Reset number of rows
Opens the Reset Rows dialog in which the new number of rows for the current table can be specified.
Sort data
Sorts the rows in increasing order, based on the x values.
This function is provided to enable the insertion of unsorted data to be viewed correctly before the table is saved. As it is a requirement that all tables be sorted on the x values before they can be used, a table sort operation will always be performed automatically whenever a table is saved.
Assign table to property
Opens the Assign Table to Property dialog to enable the assignment of the current table to beam, plate and/or brick properties. For example, stress vs strain tables can be assigned to element properties as they are defined instead of retrieving them from the respective property dialogs later.
Convert to response spectrum
Opens the Response Spectrum from Time History Table dialog, which enables the current Displacement vs Time table, Velocity vs Time table, or Acceleration vs Time table to be converted into a spectral response table and saved as a Factor vs Frequency/Period table.
Integrate as Velocity/Displacement vs Time Table
If used on an Acceleration vs Time table, it enables the creation of a new velocity vs time table by integrating the acceleration values as a function of time. The new table is saved as a Velocity vs Time table.
If used on a Velocity vs Time table, it enables the creation and of a new displacement vs time table by integrating the velocity values as a function of time. The new table is saved as a Displacement vs Time table.
Copy graphic to clipboard
Copies the graph to the clipboard as an image.
Graph options
Opens the Tables: Graph Options dialog where graph display parameters (colours, fonts, scale, etc.) can be set.
Right-click Functions
Right-clicking the spreadsheet area opens a popup menu and provides additional functions. See Strand7 Interface: Right-click Functions.
See Also
- Strand7 Interface: Spreadsheet
- Properties Common Controls
- Tables: Graph Options
- Special Topics: How Solvers Use Tables
- Tables: Equation Editor
- Tables: Assign Table to Property
- Tables: Convert to Response Spectrum
- Global: Properties
- The SOLVERS Tab
- File Formats: Table Data File
- Print Preview: Printing Layouts