Graph Options: View Range
Description
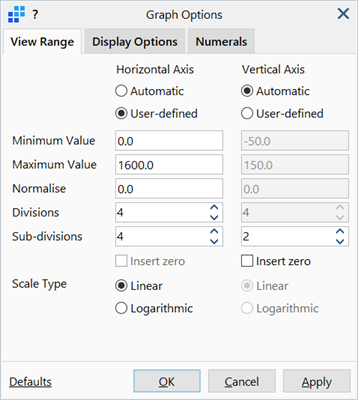
Options to adjust graph axis limits, number of divisions and scaling.
Dialog
Horizontal Axis / Vertical Axis
If Automatic is selected, the axis range and divisions are automatically determined from the plotted data range.
If User-defined is selected, the axis range and divisions can be set manually.
Minimum Value
Lower bounds of the graph axis.
Maximum Value
Upper bounds of the graph axis.
Normalise
Factor used to scale numerical data for the corresponding axis. The data points are divided by the factor (if non-zero).
For example, a normalise value of 2.5 will scale the value range [-5.0, 5.0] to [-2.0, 2.0].
Divisions
Number of equally spaced divisions along an axis.
Divisions are indicated using grid lines.
Sub-divisions
Number of equally spaced sub-divisions between each division.
Sub-divisions are indicated using tick marks.
Insert Zero
If set, the axis extends to contain the zero value, if it is not already part of the range.
Scale Type
Each axis can be plotted in either a linear scale of a logarithmic (base 10) scale.
Logarithmic scales are useful when comparing values that differ in orders of magnitude.
Defaults
Sets all settings on this tab to factory defaults or to previously saved user settings.
If Save as User Defaults is selected, the current settings on this tab are saved as the user settings and become the default settings for any new graphs created (in any model). See Preferences: Folder Locations.
See Also