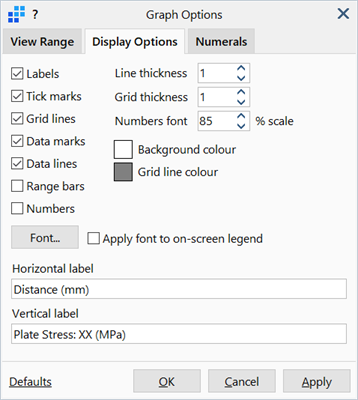
Graph Options: Display Options
Description
Customises the display of the graph.
Dialog
Labels
If set, places numerical values at grid lines along each axis.
Tick marks
If set, draws marks to indicate sub-divisions between grid lines.
Grid lines
If set, draws lines perpendicular to each axis to mark major divisions.
Data marks
If set, draws marks on the graph at each data point.
Data lines
If set, draws lines on the graph between each data point.
Range bars
If set, draws bars at each data point to indicate maximum and minimum values.
Only applicable to element result quantities (such as stress) at data points that occur at the interface of multiple elements that are averaged to produce the data point.
Numbers
If set, displays the corresponding numerical values at each data point on the graph. Data point numerals are non-overlapping, so if the graph contains a large number of data points, not every point will be labelled. More data points are labelled if the graph window is enlarged.
Line Thickness
Thickness of graph lines in pixels.
Grid Thickness
Thickness of grid lines in pixels.
Numbers Font (% scale)
If Numbers is set, scales the font for the values using the scale specified here. Size is specified as a percentage of the label font. By reducing the scale, more data points are labelled.
Background colour
Colour of the graph background.
Grid line colour
Colour of the major grid lines, tick marks and boundary of the graph.
Graph line colour
Colour of the graph lines that connect the data points.
Font...
Opens the Settings: Font Selection dialog to adjust the font type, size, style and colour of the labels. Note that the font for the point inspector shown when hovering over a data point is adjusted under Preferences: Inspect and Browse.
Apply font to on-screen legend
If set, applies label font settings to legend text.
Horizontal label
X axis title.
Vertical label
Y axis title.
Defaults
Sets all settings to factory defaults or to previously saved user settings.
If Save as User Defaults is selected, the current settings are saved as the user settings and become the default settings for any new graphs created (in any model). See Preferences: Folder Locations.
See Also