Results Graphs: 2D Graph Tab
Description
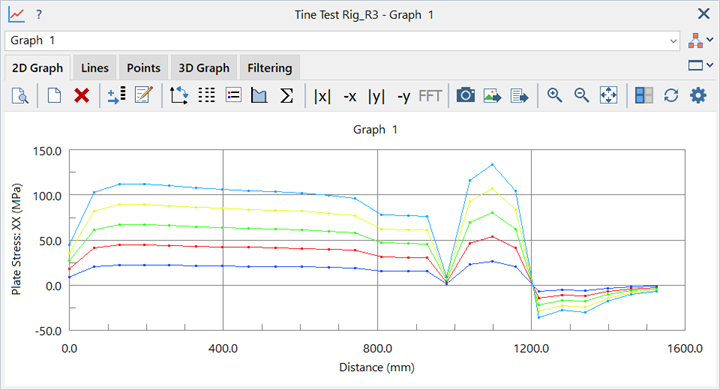
Extracts and displays results in the form of a 2D XY plot.
Dialog
Common Controls
Print preview
Displays a preview of the printed graph.
See Print Preview: Printing Layouts.
New graph
Creates a new graph.
Delete graph
Deletes the current graph.
If <None> is selected in the graph list, the option to delete all graphs is given.
Add new data
Adds a new line to the current graph.
Edit graph name
Edits the name of the current graph.
Swap axes
Swaps the orientation of the X and Y axes.
Use dashed black lines
If set, draws black dashed lines instead of coloured lines.
Show legend
If set, shows the graph legend.
Show integrals
If set, displays integrals of all lines in the graph.
Integrals are meaningful for result quantities with units of quantity per length (e.g., plate forces, which have units of force per length).
-
Area
Integral of the line.
For example, the area integral of a force per length distribution is equal to the total force on that line.
-
Length*Area
Integral of the line, where the value at each point is scaled by the distance from the midpoint of the X range.
For example, the length × area integral of a force per length distribution is equal to the total moment on that line.
The [G] integral considers the full X axis range of all lines. The [L] integral considers only the X axis range of the line itself.
[G] and [L] integrals can be different if the graph contains multiple data lines each with different X axis ranges. This can occur in vs Position graphs, for example.
Show sum
If set, displays the summation of all lines in the graph.
-
Sum
Summation of all points for each line.
For example, summation of nodal reaction forces is equal to the total reaction force on that line.
-
Length*Sum
Summation of all points for each line, where the value at each point is scaled by the distance from the midpoint of the X range.
For example, the length × area summation of nodal reaction forces is equal to the total reaction moment on that line.
The [G] summation considers the full X axis range of all lines. The [L] summation considers only the X axis range of the line itself.
[G] and [L] sums can be different if the graph contains multiple data lines each with different X axis ranges. This can occur in vs Position graphs, for example.
Absolute x values
If set, the absolute value of the x component is taken for each data point.
Negative x values
If set, the x component for each data point is multiplied by -1.
Absolute y values
If set, the absolute value of the y component is taken for each data point.
Negative y values
If set, the y component for each data point is multiplied by -1.
Fast Fourier Transforms
If set, computes and plots the Fast Fourier transform of all lines in the graph.
The Fourier transform decomposes a signal into its constituent frequencies, giving a frequency domain representation of the original data.
Applicable only to transient dynamic and harmonic time history graphs.
See Results Interpretation: Fast Fourier Transform.
Copy graph image to clipboard
Copies the graph as an image to the clipboard, allowing for the graph to be pasted elsewhere.
Export as Image
Saves the current graph to an image file in one of bmp, jpg or png formats.
Export data
Saves point data to a text file.
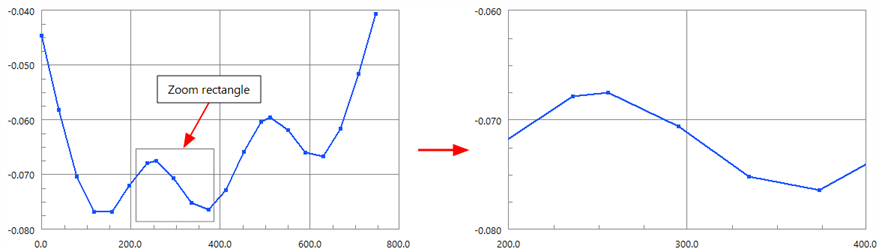
Zoom in
Zooms in to an area of the graph. The area is set by clicking and dragging the mouse cursor to form a rectangular region.
The zoom in area snaps to the nearest graph division based on the existing graph range. This ensures that the bounds of the zoomed graph remain on division boundaries.
Zoom out
Zooms out to fit the graph to an area. The area is set by clicking and dragging the mouse cursor to form a rectangular region.
Similarly to Zoom in, the zoom out area snaps to the nearest graph division based on the existing graph range. This ensures that the bounds of the zoomed graph are on division boundaries.
Reset zoom
Sets the graph axes to the default ranges.
Include/exclude hidden entities
If set, results extracted at positions shared by multiple entities consider the contributions from hidden entities producing average results.
If not set, results extracted do not consider the contributions from hidden entities; results are averaged only between visible entities.
Refresh graph
Regenerate the graph to consider changes made to the model, such as entity visibility, reference displacement case, etc.
Graph Options
Opens the Graph Options dialog.
See 2D Graph Tab: Graph Options
See Also