Results Graphs: Points Tab

Description
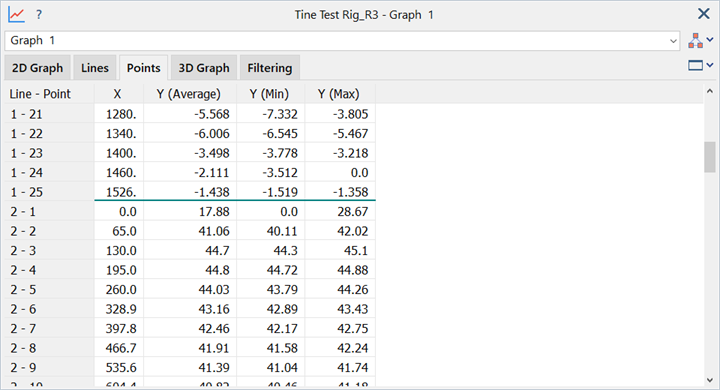
Data points for each line displayed in tabular form.
Data for each line is stacked and separated by a thick line.
The first digit in the label of the Line - Point column indicated the line number, while the second digit indicates the point number (e.g., 3-6 indicates the sixth point of line 3).
Dialog
Common Controls
Point
Line and data point Identifier.
Identifier is in the form <line number> : <point number>.
X
The horizontal axis value of the data point.
Y Values
Multiple values may exist at a common point. For example, multiple stress quantities values exist at element interfaces. The range of these values is described by the Average, Min and Max values.
For quantities where only one value exists (for example, displacement values at nodes), all three columns will show the same value.
-
Y (Average)
Average of the vertical axis values.
Determines the position of the data point on the graph.
-
Y (Min)
Minimum vertical axis value of the data point.
Determines the position of the lower point of the range bar.
-
Y (Max)
Maximum vertical axis value of the data point.
Determines the position of the upper point of the range bar.
-
Integral XY / Integral YX
The area under the graph, integrated along the X axis / Y axis at each point.
These columns are available for vs Result Case type graphs and give the cumulative integral along the two axes at each point in the graph. This quantity does not always have a physical meaning so needs to be considered in context (an example of a practical use might be for summing the cumulative energy in an element at each result case from a plot of force vs displacement where displacement comes from a freedom case factor in the result case).
See Also