Results Graphs: 3D Graph Tab
Description
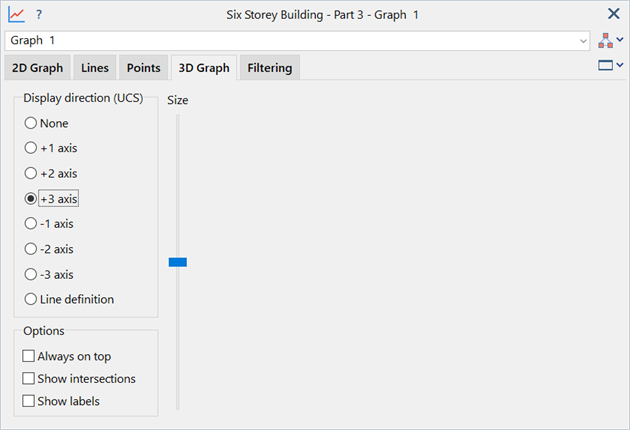
Configures display of 3D graphs directly on the model.
Dialog
Common Controls
Display direction (UCS)
Direction in which to draw the vertical axis of the graph onto the model. Axes 1, 2 and 3 refer to the first, second and third axes respectively of the UCS in which the graph segment was produced; not to be confused with the currently selected UCS.
If Line definition is set, the display direction is determined by the 3D Axis of individual line segments set under the Results Graphs: Lines Tab.
Always on top
If set, the 3D graph is always rendered on top of all other entities in the model.
Show intersections
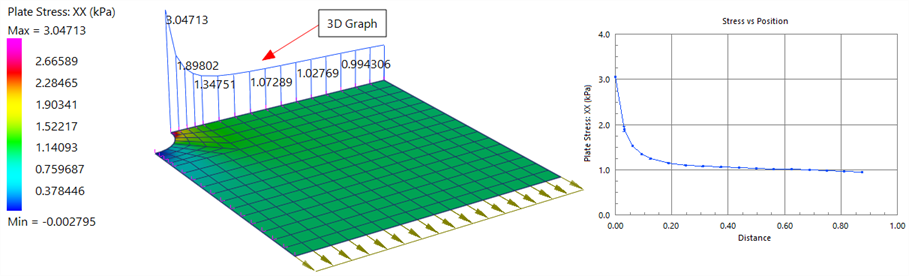
If set, displays a vertical line at the position of each data point, in the plane of the graph and intersecting the model at the point at which the value is read.
Show labels
If set, displays Y (Average) values at each data point. Data point numerals are non-overlapping, so if the graph contains a large number of data points, not every point will be labelled. More data points are labelled if the model window is enlarged or the graph area is zoomed.
Size
Adjusts the relative size of the 3D graph.
Maximum size allowed is 50% of the largest dimension of the model's View: Bounding Box.
See Also