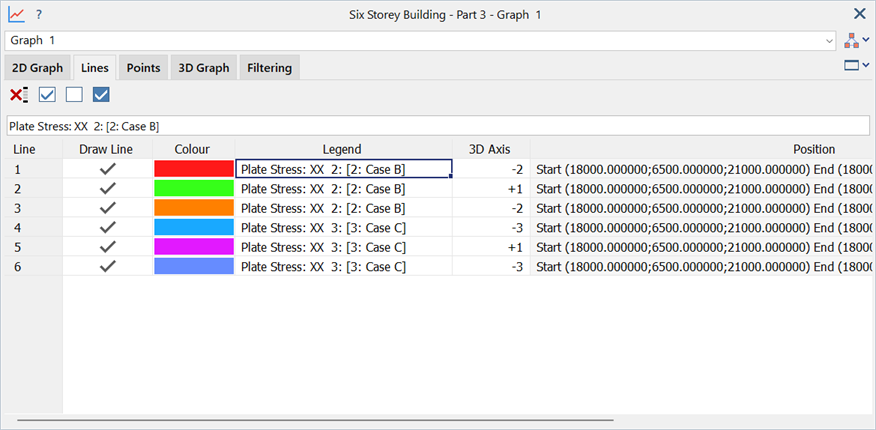
Results Graphs: Lines Tab
Description
List of lines added to the graph.
Dialog
Common Controls
Delete lines
Deletes highlighted lines from the graph.
Selections
Selects all, clears all or inverts selections cases under the Draw Line column.
Draw line
If set, the line is displayed on the graph.
If not set, the line is hidden.
Colour
Colour of the line on the graph.
Double-click the colour cell to open the colour selection dialog or edit the colour as described in Strand7 Interface: Spreadsheet.
Legend
Line label shown in the graph legend.
3D Axis
The UCS axis on which the 3D graph is drawn (see Results Graphs: 3D Graph Tab). This is the axis of UCS in which the graph segment was produced; not the currently selected UCS.
Position
Position(s) used to extract the data points. This is read-only data.
Case
Result case used to extract the data points. This is read-only data.
See Also