Results Graphs: Filtering Tab
Description
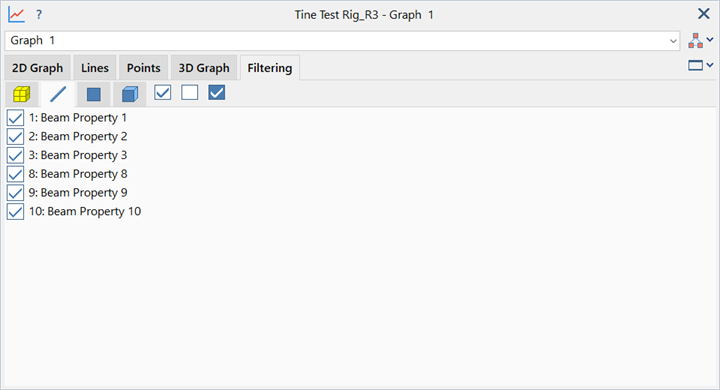
Selects groups and properties for which element results are to be considered for graphing purposes.
This feature allows graphs to be plotted at the junctions between different groups or properties, while selecting the elements that are to contribute to the graph. Without this feature, the results of all elements intersected by the graph line will be averaged for the graph; the feature allows for the selective exclusion of elements.
A yellow cube indicates that the group is considered while a grey cube indicates that a group is ignored. Similarly, a check mark indicates that the property is considered while a clear box indicates that the property is ignored.
Results of an element are only included if both its group and its property are considered, otherwise the element does not contribute to the graph.
Dialog
Selections
Selects all, clears all or inverts the active state of groups and/or properties.
See Also