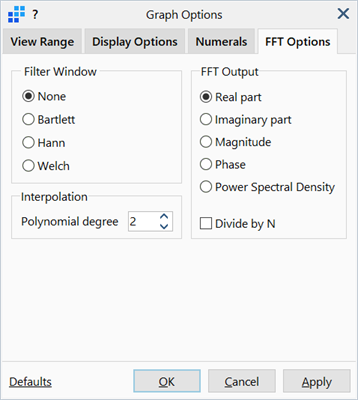
Graph Options: FFT Options
Description
Customises the FFT (Fast Fourier Transforms) parameters of the graph. This tab is only available for transient dynamic and harmonic time history result graphs. See Results Interpretation: Fast Fourier Transform.
Filter Window
The technique that pre conditions the raw data to help identify the distinct frequencies more clearly. This helps avoid the so called leakage where adjacent frequencies interact with each other. Four filtering options are available:
-
None
No data window (this corresponds to using a rectangular window).
-
Bartlett
A triangular shape window (from zero to maximum then back to zero).
-
Hann
Similar to Welch window but the curve is flattened at the start and end points.
-
Welch
A half-sine-like shape window.
Literature suggests that the square window is the least favourable when compared to Welch and Bartlett windows. Note however, that the outcome is also affected by other factors such as the property of the time history, sample length, etc.
Interpolation
Specifies the order of the polynomial function that is used to curve-fit the graph results for the purpose of FFT.
The FFT algorithm requires the number of sampled data points to be a power of 2 with a constant sampling interval (i.e., constant time step). This means that the Strand7 results may be required to be re-sampled (i.e., interpolated) before the FFT can be generated.
To do this, a piecewise polynomial of user-selected degree is fitted through the result data which is then re-sampled using a constant time step. The number of steps used is set as the number of raw data points taken to the next highest power of 2. The constant time step is then the original range in the data divided by this new number of steps.
FFT Output
FFT typically outputs data of complex values even if the source data is recorded in real values. Assuming that the FFT has generated a complex number (e.g.,  , where
  is the imaginary unit), at frequency
  , the FFT output can be displayed as one of the following quantities:
-
Real part
The real part
 of the complex number.
 -
Imaginary part
The imaginary part
 of the complex number.
 -
Magnitude
The magnitude
 of the complex number.
 -
Phase
The phase angle of the complex number.

-
Power Spectral Density

where
 is the sampling interval in the time domain,
  is frequency and is the Nyquist frequency
  .
.
Divide by N
Divide the forward Fourier transform by  where
where  is the number of sampling points.
Defaults
Sets all settings to factory defaults or to previously saved user settings.
If Save as User Defaults is selected, the current settings are saved as the user settings and become the default settings for any new graphs created (in any model). See Preferences: Folder Locations.
See Also