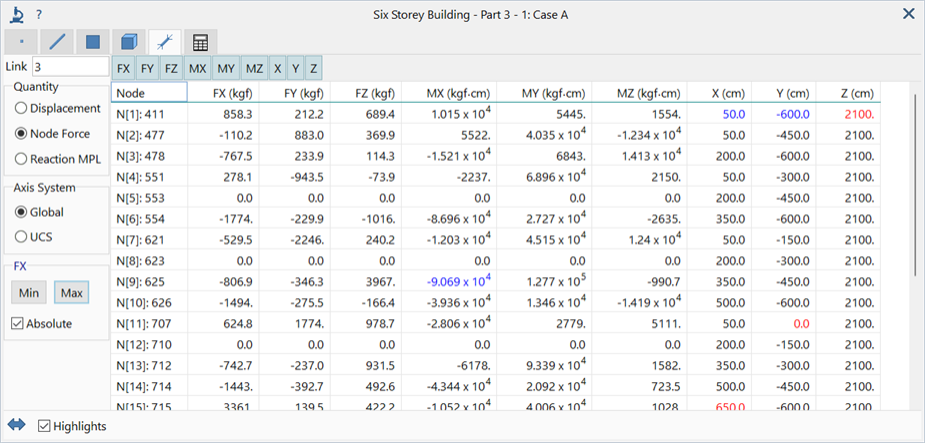
Results Peek: Entity Tabs
Description
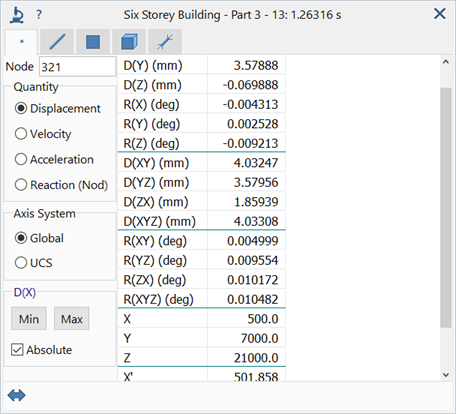
Inspects results of a single entity (node, beam, plate, brick or link).
An entity tab is shown for nodes, beam, plates, bricks and links if any of the corresponding entities are defined in the model.
Each entity tab contains result quantities relevant to that entity type.
Entity Number
Number that identifies the entity.
When the Peek window is visible, the Strand7 Interface: Hot Pointer is always active, enabling entity numbers to be retrieved directly from the model window.
Entity numbers may also be entered manually.
Quantity
Result quantity to retrieve.
Only result quantities applicable to the selected entity type are listed. See Results Interpretation: Result Quantities.
Axis System
Axis system in which the selected result quantity is expressed.
Depending on the entity and quantity type, available axis systems may be Principal, Local, Global, UCS, Restraint UCS and Combined. Combined indicates result quantities that comprise multiple components to produce a result; these include principal stress and von Mises stress. Restraint UCS refers to the UCS of the restraint attribute applied to the node, in the 1-2-3 system (i.e., first, second and third axis of the UCS).
Result Grid
Grid containing the result quantities/components and their corresponding values.
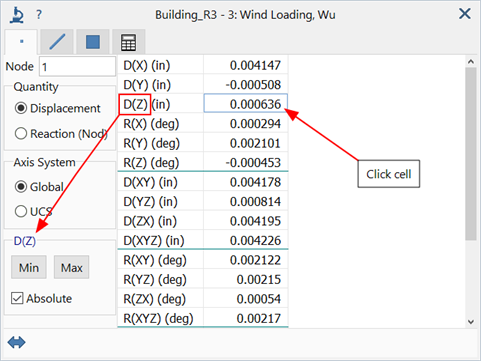
Min/Max
Finds the entity with the minimum or maximum of a particular quantity and component, and reports the entity in the Peek window. The entity is also highlighted in the model window, firstly by a series of animated concentric circles to draw attention to the entity, and finally by drawing a dashed line around the highlighted entity.
The option applies only to visible entities in the model window; hidden entities are not considered.
The active result quantity to be used for the search is set by clicking a cell in the grid; once clicked, its caption is set as the Min / Max group caption to indicate the quantity that will be searched.
Absolute
If set, only the magnitude of the result is considered when searching for the minimum or maximum.
If not set, the signed value is considered when searching for the minimum or maximum.
Show/hide Side Panel
Shows or hides the side panel in the peek window.
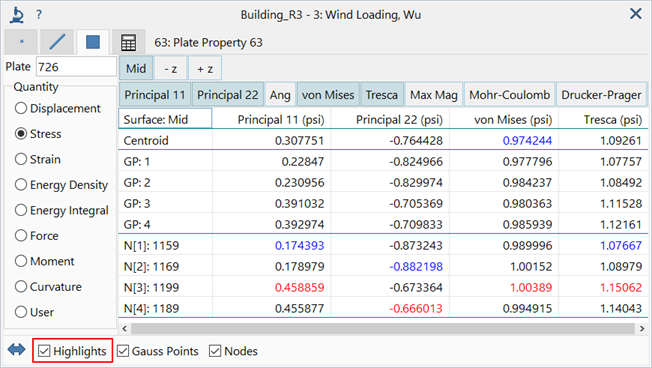
Highlights
If set, minimum and maximum values in each column of data in the grid are highlighted in blue and red respectively.
If not set, all text in the grid will be of the same colour.
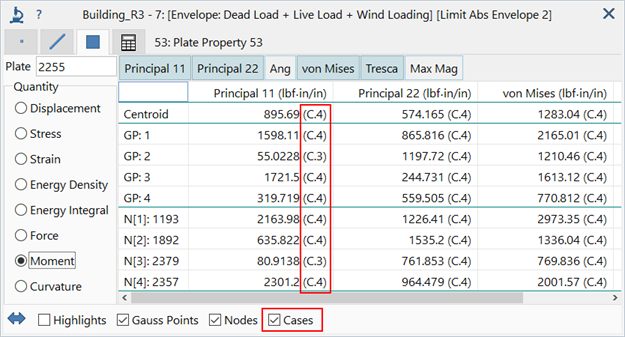
Cases
If set, shows the result case numbers from which envelope results are obtained. The case number is the index in the result case dropdown list, and not necessarily the load case number, which may have gaps in the numbering.
Available for envelope result cases only.
Beam Tab
Slices
The number of intermediate slices along a single beam element from which results are extracted. See Results Interpretation: Beam Slices.
Section Quantity
The Section quantity is used to present result quantities contoured over the beam cross section at a particular slice along its length.
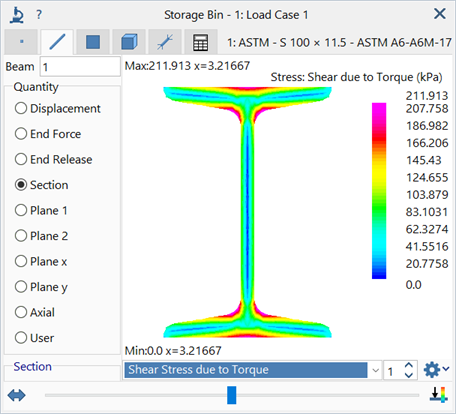
Section result options
Dropdown list of result quantities available on the beam cross section. Quantities include various stress and strain components, amongst others.
Section display options
Options to show/hide section outline, and to change outline colour and fill pattern of diagrams.
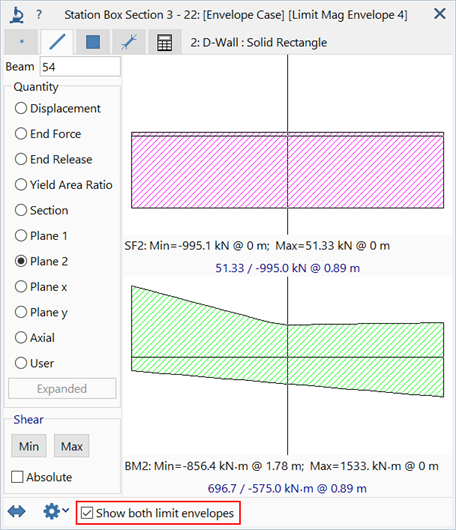
Show both limit envelopes
If set, result diagrams of any limit envelope case (see CASES: Envelope Cases) are displayed with both the minimum and the maximum values at the same time.
Position along beam
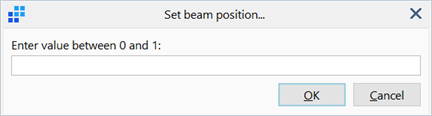
Slider that specifies the position along the beam at which to extract results, when Number of Slices is set to 1.
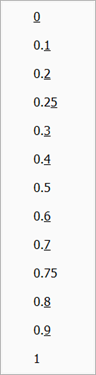
Right-click the slider to specify a precise slice position, or to select from a list of preset positions.
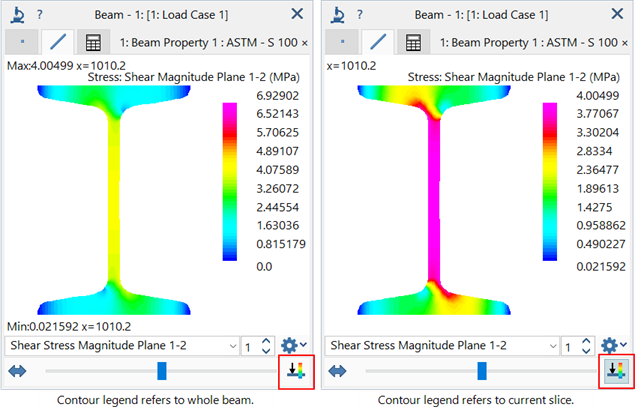
Contour legend - whole beam or slice
Toggles the range of the contour legend in the peek window to include only result values at the current slice or over the entire beam element.
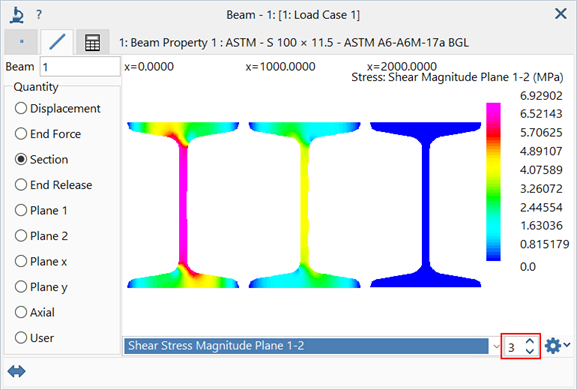
Number of Section Slices
Number of slices to take along the beam for section rendering. This enables the simultaneous display of cross section results at multiple positions along the beam.
Slices are taken at equidistant intervals with the two ends always included. For example, setting three slices produces the first slice at end 1 of the beam, the second slice at mid-length and the third slice at end 2 of the beam.
Beam Plane 1 / Plane 2 / Plane x / Plane y / Axial
These quantities enable the plotting of shear force, bending moment and axial force diagrams along the beam length.
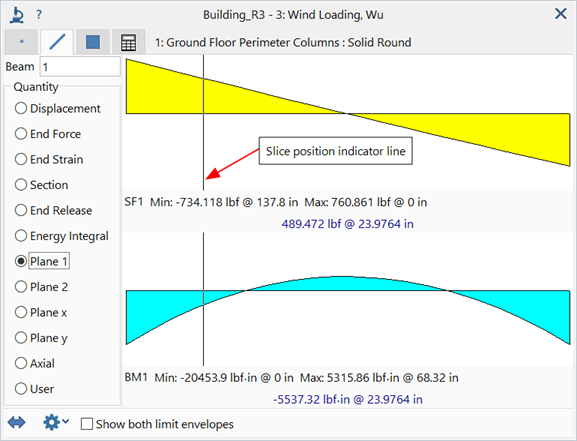
The position can be set by clicking anywhere along the diagrams to set the vertical slice indicator line.
Alternatively, right-click the diagrams to specify a precise slice position, or to select from a list of preset positions.
The right-click menu also offers the option to copy the image as well as the diagram values as text to the clipboard, for pasting to other applications.
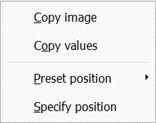
Plate and Brick Tabs
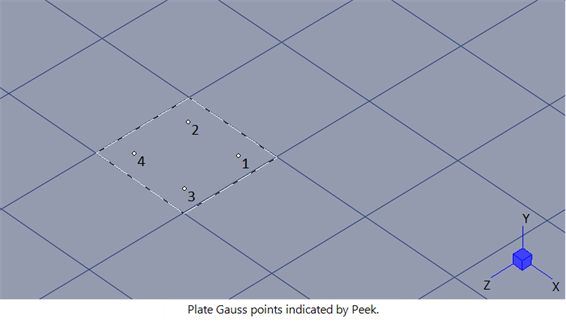
Gauss Points
If set, results at the Gauss points are listed.
Gauss point locations are indicated on the element in the model window. See Results Interpretation: Gauss Point Extrapolation and Averaging.
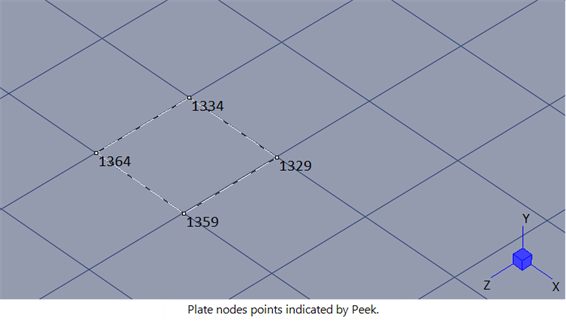
Nodes
If set, results at the nodes are listed.
Results at the nodes are extrapolated from the Gauss points. The values reported may depend on the Node Average option.
Node numbers are displayed on the element in the model window.
Node Average
Averaging method used when reporting result quantities at nodes.
Available only if Nodes is set.
Link Tab
Displays link-specific result quantities such as node forces at the link ends and force and moment summation of Reaction MPLs. See Results Interpretation: Result Quantities.
See Also
- Global: User Coordinate System (UCS)
- Results Peek: Calculator Tab
- Results Interpretation: Gauss Point Extrapolation and Averaging
- Results Interpretation: Expanded Envelope Results
- Results Interpretation: Result Quantities
- Results: Element Results Equations
- Results Interpretation: Beam Slices
- Results Interpretation: Beam Force and Moment Conventions