The LISTINGS Tab
Description
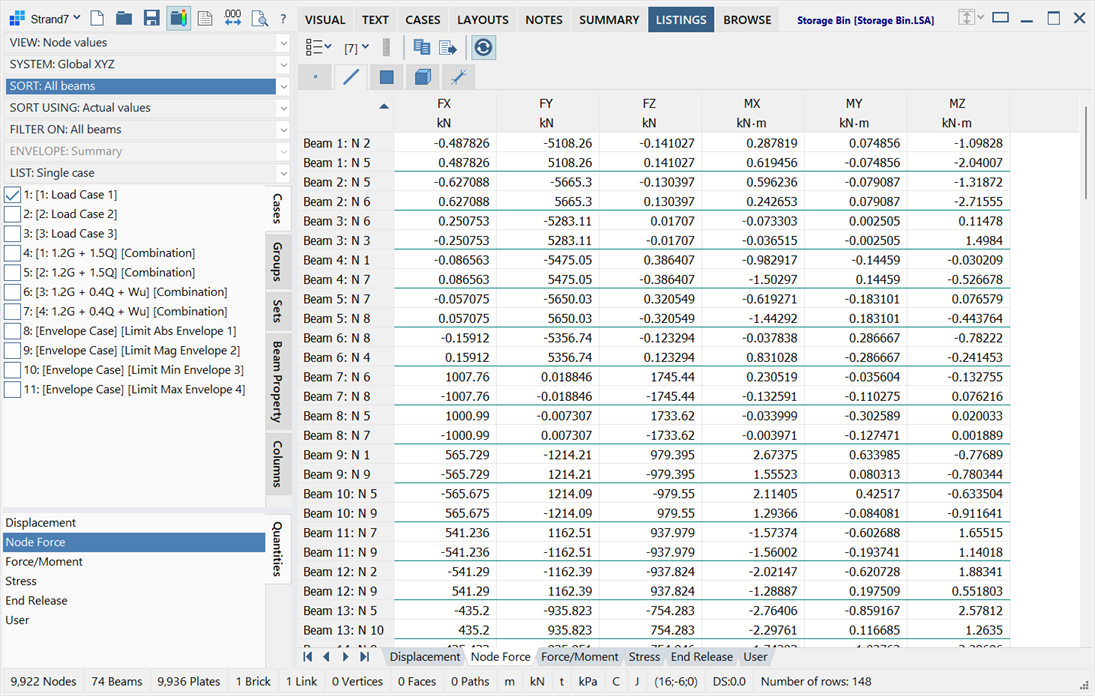
The LISTINGS tab displays analysis results such as displacements, stresses and reactions in a grid for viewing and post-processing purposes.
Data in the grid can be sorted, filtered, printed, saved to a text file, or copied for pasting to other applications.
Cells in the grid are read-only and cannot be edited.
Filter Pane
Situated at the top left corner, the filter pane consists of filtering options and coordinate systems presented via a stack of dropdown lists, together with various vertical tabs. These enable the configuration and display of specific analysis results in the grid.
The presence of a dropdown list depends on the entity, the data being listed, the result case and a number of other considerations. Also, changing the selection of a dropdown list may affect the presence or absence of a dropdown list below it in the stack.
The contents of the dropdown lists are designed to convey both their purpose and their selection. Each dropdown list contains text items of the form "PURPOSE: Selection". For example, in the beam results tab the dropdown list shown below may be available. This dropdown list tells us that its purpose is to enable us to select what to VIEW in the grid. From this list we can select one of six options to views ('Beam stations fixed', 'Beam ends', 'Beam end 1', 'Beam end 2', 'Beam station summary', 'Beam ends summary').
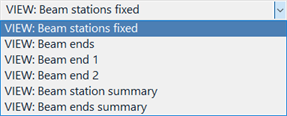
VIEW:
Selects how much data, or the location of the data, to report for beams, plates, bricks and links.
-
For beams
Results can be listed at stations along each beam, or only at the ends (end 1, end 2 or both ends) depending on the quantity and the result case. The number of stations can be set using the beam Slices setting (see Number of beam stations section below). The station summary and end summary options (e.g., VIEW: Beam station summary) provide one result per beam element together with the location of that result (see SHOW: option below). See Results Interpretation: Beam Slices.
-
For plates and bricks
Results can be listed at the centroid, the nodes or Gauss points of the element. The summary options (e.g., VIEW: Gauss point value summary) provide one result per element together with the location of that result (see SHOW: option below).
-
For links
Results are available at the nodes of the link. The summary options (e.g., VIEW: Node value summary) provide one result per link together with the location of that result (see SHOW: option below).
STRAIN:
Selects the definition of strain to report.
-
Deformation
Reported strain results are derived from element deformation only. That is, initial strains due to pre-strain attributes, thermal expansion, etc., are not considered.
-
Total
Reported strain results include both deformation strain as well as initial strains due to pre-strain, thermal expansion, etc.
AVERAGE:
Specifies the averaging scheme to be used. The available options are Never, Always and Same Property. This option becomes available when listing certain plate and brick results at the nodes (e.g., stress).
Note that the Facet angle set under Results: Element Results Settings influences the plate results if the AVERAGE is set to either Always or Same Property.
SHOW:
Specifies the criteria by which the results summary is produced when a summary option (e.g., VIEW: Node value summary) is selected. The available criteria are Biggest Absolute, Smallest Absolute, Highest Value and Lowest Value. In a summary view, a single result value is displayed, along with the position at which it occurred.
For example, if a Quad4 plate element has Gauss point stresses of +1.2, +0.6, -1.6 and -1.9, the Biggest Absolute value summary will display "1.9 (4)" - that is, the biggest magnitude is 1.9 and it occurs at Gauss point 4 (shown in brackets). The number in brackets is the summary location; it can identify a node, a Gauss point, an end or station at which the value occurs, depending on the element and results listed. The summary location can be turned on or off by setting or clearing the option Show Summary Locations under Display options (see below).
This dropdown list is available when a summary option is selected in the VIEW: dropdown list.
PLIES:
Selects whether to show results on all plies of a plate element, or on a single ply based of a plate element based on the summary option.
The Ply summary option uses the criterion specified in SHOW: (biggest, smallest, highest, lowest) to select a single ply on the plate for listing. Similarly to the SHOW: summary option, the ply that satisfies the criteria is identified as number in brackets.
In the case where both the SHOW: and the PLIES: summary options are activate (e.g., VIEW:Gauss point value summary together with PLIES: Ply summary), two numbers will appear in brackets - the ply number followed by the location number (e.g., ply number, Gauss point number).
This dropdown list is available when viewing laminate ply results.
PLANE:
Specifies the plane of interest when showing plate stress and strain results: mid-plane, +z surface or -z surface. The +z and -z surfaces refer to the plate's local axis system.
Plate stress and strain may vary through the thickness of a plate element in bending.
AXIS:
Specifies the axis system to display beam results: local, principal or global.
SYSTEM:
Selects the coordinate system in which the result quantities are defined.
Depending on the entity and quantity type, available axis systems may be Principal, Local, Global, UCS, Restraint UCS and Combined. Combined indicates result quantities that are independent of axis systems, such as von Mises stress. Restraint UCS refers to the UCS of the restraint attribute applied to the node using the 1-2-3 system (i.e., first, second and third axis of the UCS).
SORT:
Specifies the scope of sort, either over all elements or within each element.
This is available when listing multiple results for an element (e.g., plate Gauss point stress).
When sorting the data in the grid, by clicking the column header in the grid, two sorting options are available. The first option, SORT: All plates, will sort the entire list of data considering just the data, to be sorted, irrespective of the element or Gauss point to which the data belongs. The second option, SORT: Within plates, will sort only the data for the Gauss points, while maintaining the element order in the list.
SORT USING:
Specifies the criteria for the values to be sorted.
Data van be sorted based on either Actual values or Absolute values.
Click the column header in the grid to sort values.
FILTER ON:
Applies a filter based on entity selections to include or exclude data from the grid.
If set to All, all entities are listed in the grid, irrespective of their selection state.
If set to Selected, only selected entities are listed are listed in the grid.
If set to Unselected, only unselected entities are listed in the grid.
ENVELOPE:
When listing envelope data, two options are available, Summary and Expanded.
The Summary option displays envelope results and, depending on the envelope, also the result cases from which the single envelope results are extracted. The envelope data occupies one row that shows the envelope result for each quantity.
The Expanded option displays envelope results in a matrix format; there will be as many rows as there are columns in the quantity being enveloped. For example, if enveloping node reactions, each node of expanded envelope results will be presented as a matrix six rows by six columns (the rows/columns in this case will correspond to FX, FY, FZ, MX, MY and MZ forces and moments at the node, if considering a Cartesian UCS). For each row, the diagonal value in the matrix will be the same value as to the corresponding Summary envelope display (e.g., the FY value in the second row of the matrix will be the enveloped FY reaction value). The other columns in the row correspond to the values that each one takes when the diagonal is the enveloped quantity (that is, they are the values that occur at the same time as FY when FY is the enveloped reaction). So each row of the matrix presents an equilibrated set of results for all corresponding components when the diagonal component is the enveloped quantity.
See Results Interpretation: Expanded Envelope Results.
LIST:
If set to Single case, only one result case can be selected at a time under the Cases tab.
If set to Multiple cases, more than one result case can be selected at the same time under the Cases tab. Shift+Click to select or unselect a range of cases quickly. When multiple cases are selected, the results for all the selected cases are listed in the grid at the same time.
Sub-tabs
These tabs offer additional filtering options based on load and freedom cases, data columns, groups, sets, IDs and directions.
-
Cases
Selects the primary, secondary (combination) and envelope results cases from which results are extracted for listing.
-
Groups
Sets the active/inactive state of groups for the listing. The state is toggled by clicking the yellow group icon.
Elements and links are shown or hidden in the listing based on the active/inactive state of their group.
Nodes, which are not explicitly assigned to a group, are shown in the listing when an element or link belonging to an active group references the node. Nodes not connected to any elements or links are shown whenever the root group in the tree is active.
-
Sets
If entity sets are defined in the model, an entity is shown in the listing if a set to which it belongs is active in the sets list according to the Set Show / Hide options. Entities that do not belong to any set are shown when the option <Entities in no set> is active.
If there are no entity sets defined in the model, the Sets tab is not relevant.
-
Entity Properties / Link Type
Selects the beam, plate and brick properties or link types to include or exclude for the listing.
-
Columns
Selects the columns to be shown or hidden in the listing.
Quantities
This is situated at the bottom left corner of the window.
It comprises the list of sub-tabs contained at the base of each entity tab in the grid and offers another way to switch between the sub-tabs.
See Results Interpretation: Result Quantities.
Entity Tabs
These are situated at the top of the grid; a tabs is shown for each of the available entities (i.e., node, beam, plate, brick and link tabs).
Number of rows
The rightmost entry of the status bar shows the number of rows contained in the listing.
Toolbar Functions
Display options
-
Show Property Numbers
If set, entries under the Property column are displayed with both the property numbers and property names.
If not set, entries under the Property column only shows the property names.
-
Show Group Paths
If set, entries under the Groups column are displayed with the full group path, including all parent groups and child group names.
If not set, entries under the Groups column only shows the child group names.
-
Show Summary Locations
If set, the number in brackets showing the node, Gauss point, beam end, beam station or ply at which the summary value occurs is shown alongside summary value.
If not set, only the summary value is shown.
Number of beam stations
Sets the number of beam stations at which the results are displayed in the listing. See Results Interpretation: Beam Slices.
RC steel units
Sets the units of area per length for steel reinforcement area results.
Copy to clipboard (Ctrl + C)
Store the values of the highlighted cells to the clipboard. See Strand7 Interface: Right-click Functions column separator for more information.
Export grid contents to file
Writes the data in the grid, including all Fixed Cells such as headers, to a text file.
Update / Autoupdate
If set, changes to any settings are reflected immediately in the results listing.
If not set, changes are not reflected until Update is clicked again.
For a very large model, it may be more efficient to turn off autoupdate, make all the required settings changes, and then turn autoupdate back on.
Right-click Functions
Right-clicking the grid opens a popup menu and provides additional functions. See Strand7 Interface: Right-click Functions.
-
Scale
Normalises all displayed values in the listing by the selected scale and indicates the selected scale factor in the column header.
For example, a value of 0.1234 is displayed as 123.4 if 0.001 scale is selected and the column header displays 10-3 as an indication of the scale used.
-
Select / Unselect Highlighted Entities
Selects or unselects entities corresponding to the highlighted cells in the TEXT tab. These entities are then selected in the model window (i.e., in the VISUAL tab).
See Also
- Strand7 Interface: Spreadsheet
- Results: Element Results Settings
- Selection Panel: Selection Entities and Mode
- Entities
- Global: Define UCS
- View Settings: Post Numbers Tab
- The Strand7 Menu
- Results Interpretation: Result Quantities
- Results Interpretation: Expanded Envelope Results
- Results Interpretation: Max and Min Beam Stresses in Envelopes
- Strand7 Interface: Group Trees